PlatformSOI400 × 180 nm waveguide
Computational Integrated Photonics Project
Reproducible SOI Add-Drop Microring Resonator
A reproducible computational workflow progressing from a converged SOI strip-waveguide model to dispersion analysis, bend-radius characterization, coupling-gap pre-screening, and a complete symmetric add-drop microring simulation.
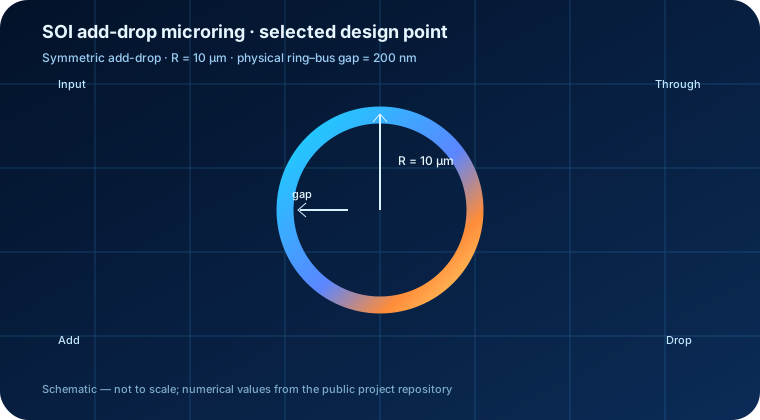
R = 10 µmgap = 200 nmMODE / varFDTD
SolverMODE / varFDTDAnsys Lumerical
AutomationPython / lumapiReproducible workflow
Wavelength1500–1600 nm4001 final samples
Project Overview
From waveguide physics to a complete resonator model
The project begins with an SOI strip-waveguide baseline and progressively builds the numerical evidence required for the final microring model. Intermediate stages characterize modal behavior, wavelength dispersion, bend-radius behavior, and coupling as a function of physical separation.
The final design is a symmetric add-drop ring simulated with the MODE varFDTD solver. Python automation through lumapi is used to support reproducible model construction, execution, data extraction, and analysis.
Final Design Point
Device and simulation parameters
- Silicon waveguide
- 400 nm × 180 nm
- Ring centerline radius
- 10 µm
- Physical ring–bus gap
- 200 nm
- Architecture
- Symmetric add-drop ring, Lc = 0
- Wavelength range
- 1500–1600 nm
- Coupling-region mesh
- 15 nm × 7.5 nm
- Spectrum samples
- 4001
- Time-decay criterion
- Auto-shutoff = 1 × 10⁻⁵
Numerical Results
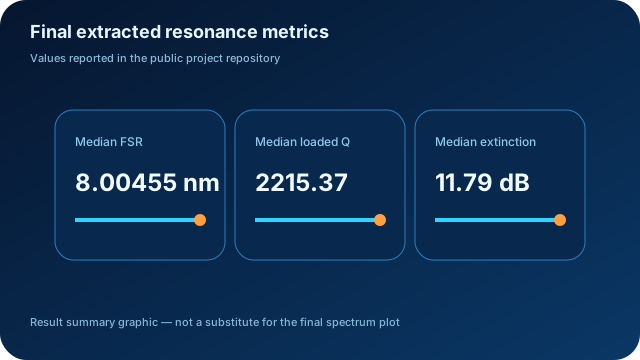
Final resonance metrics
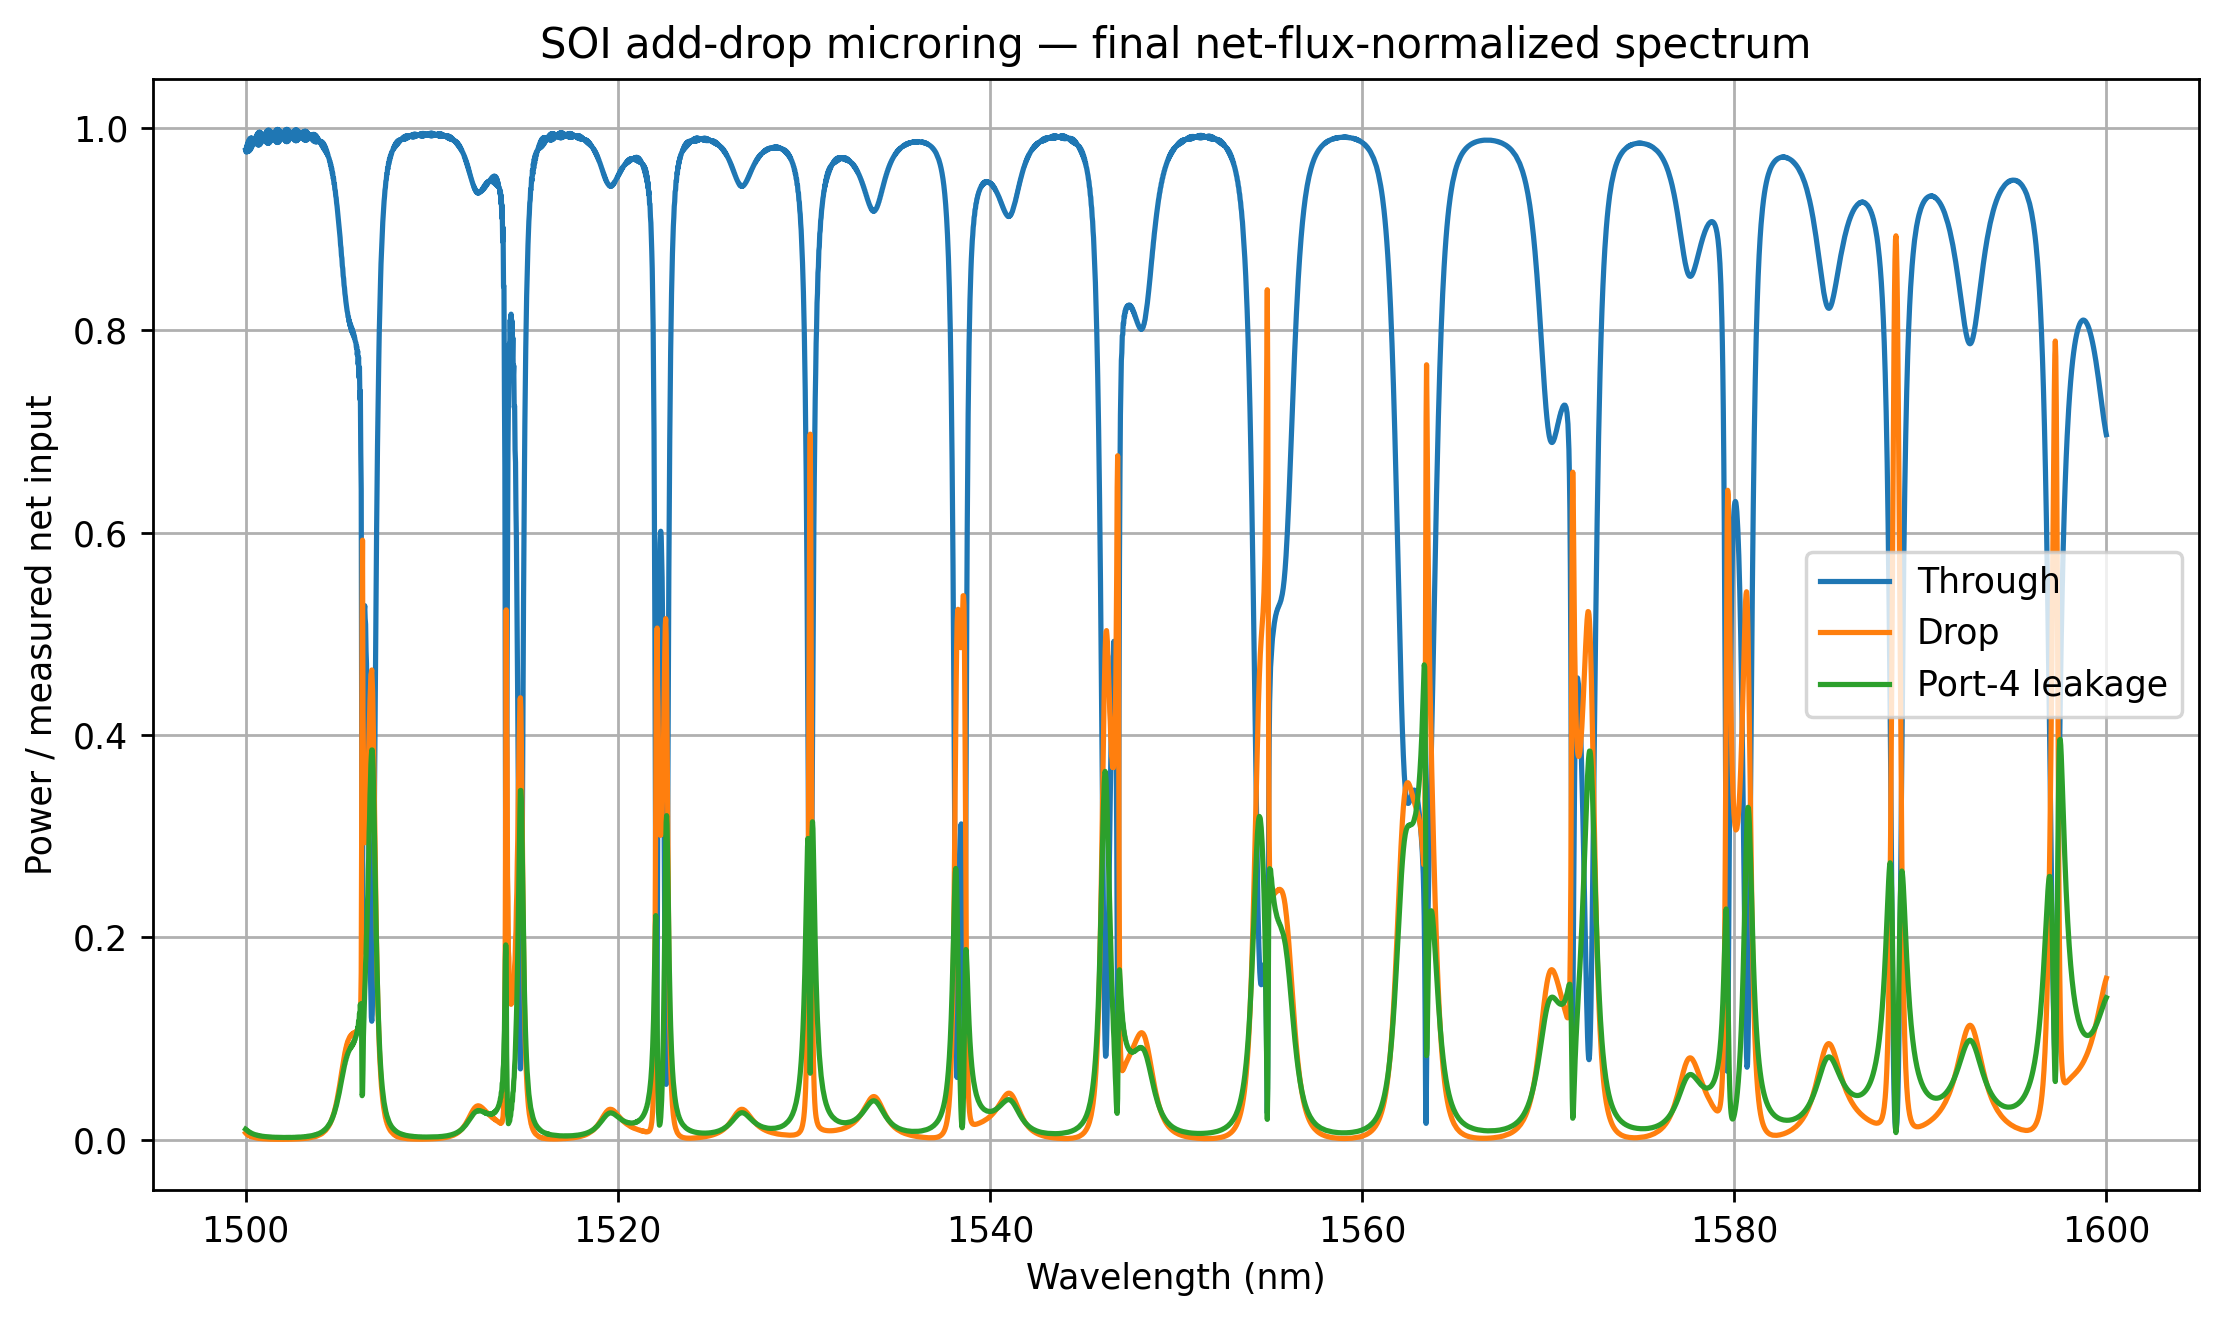
Reported values correspond to the final public varFDTD simulation and its extracted resonance dataset.
- Median FSR
- 8.00455 nm
- Mean FSR
- 8.21387 nm
- Median loaded Q
- 2215.37
- Loaded-Q range
- 853–4614
- Median extinction ratio
- 11.79 dB
- Median net-flux balance
- 0.99751
Result Figures
Selected outputs from the public repository
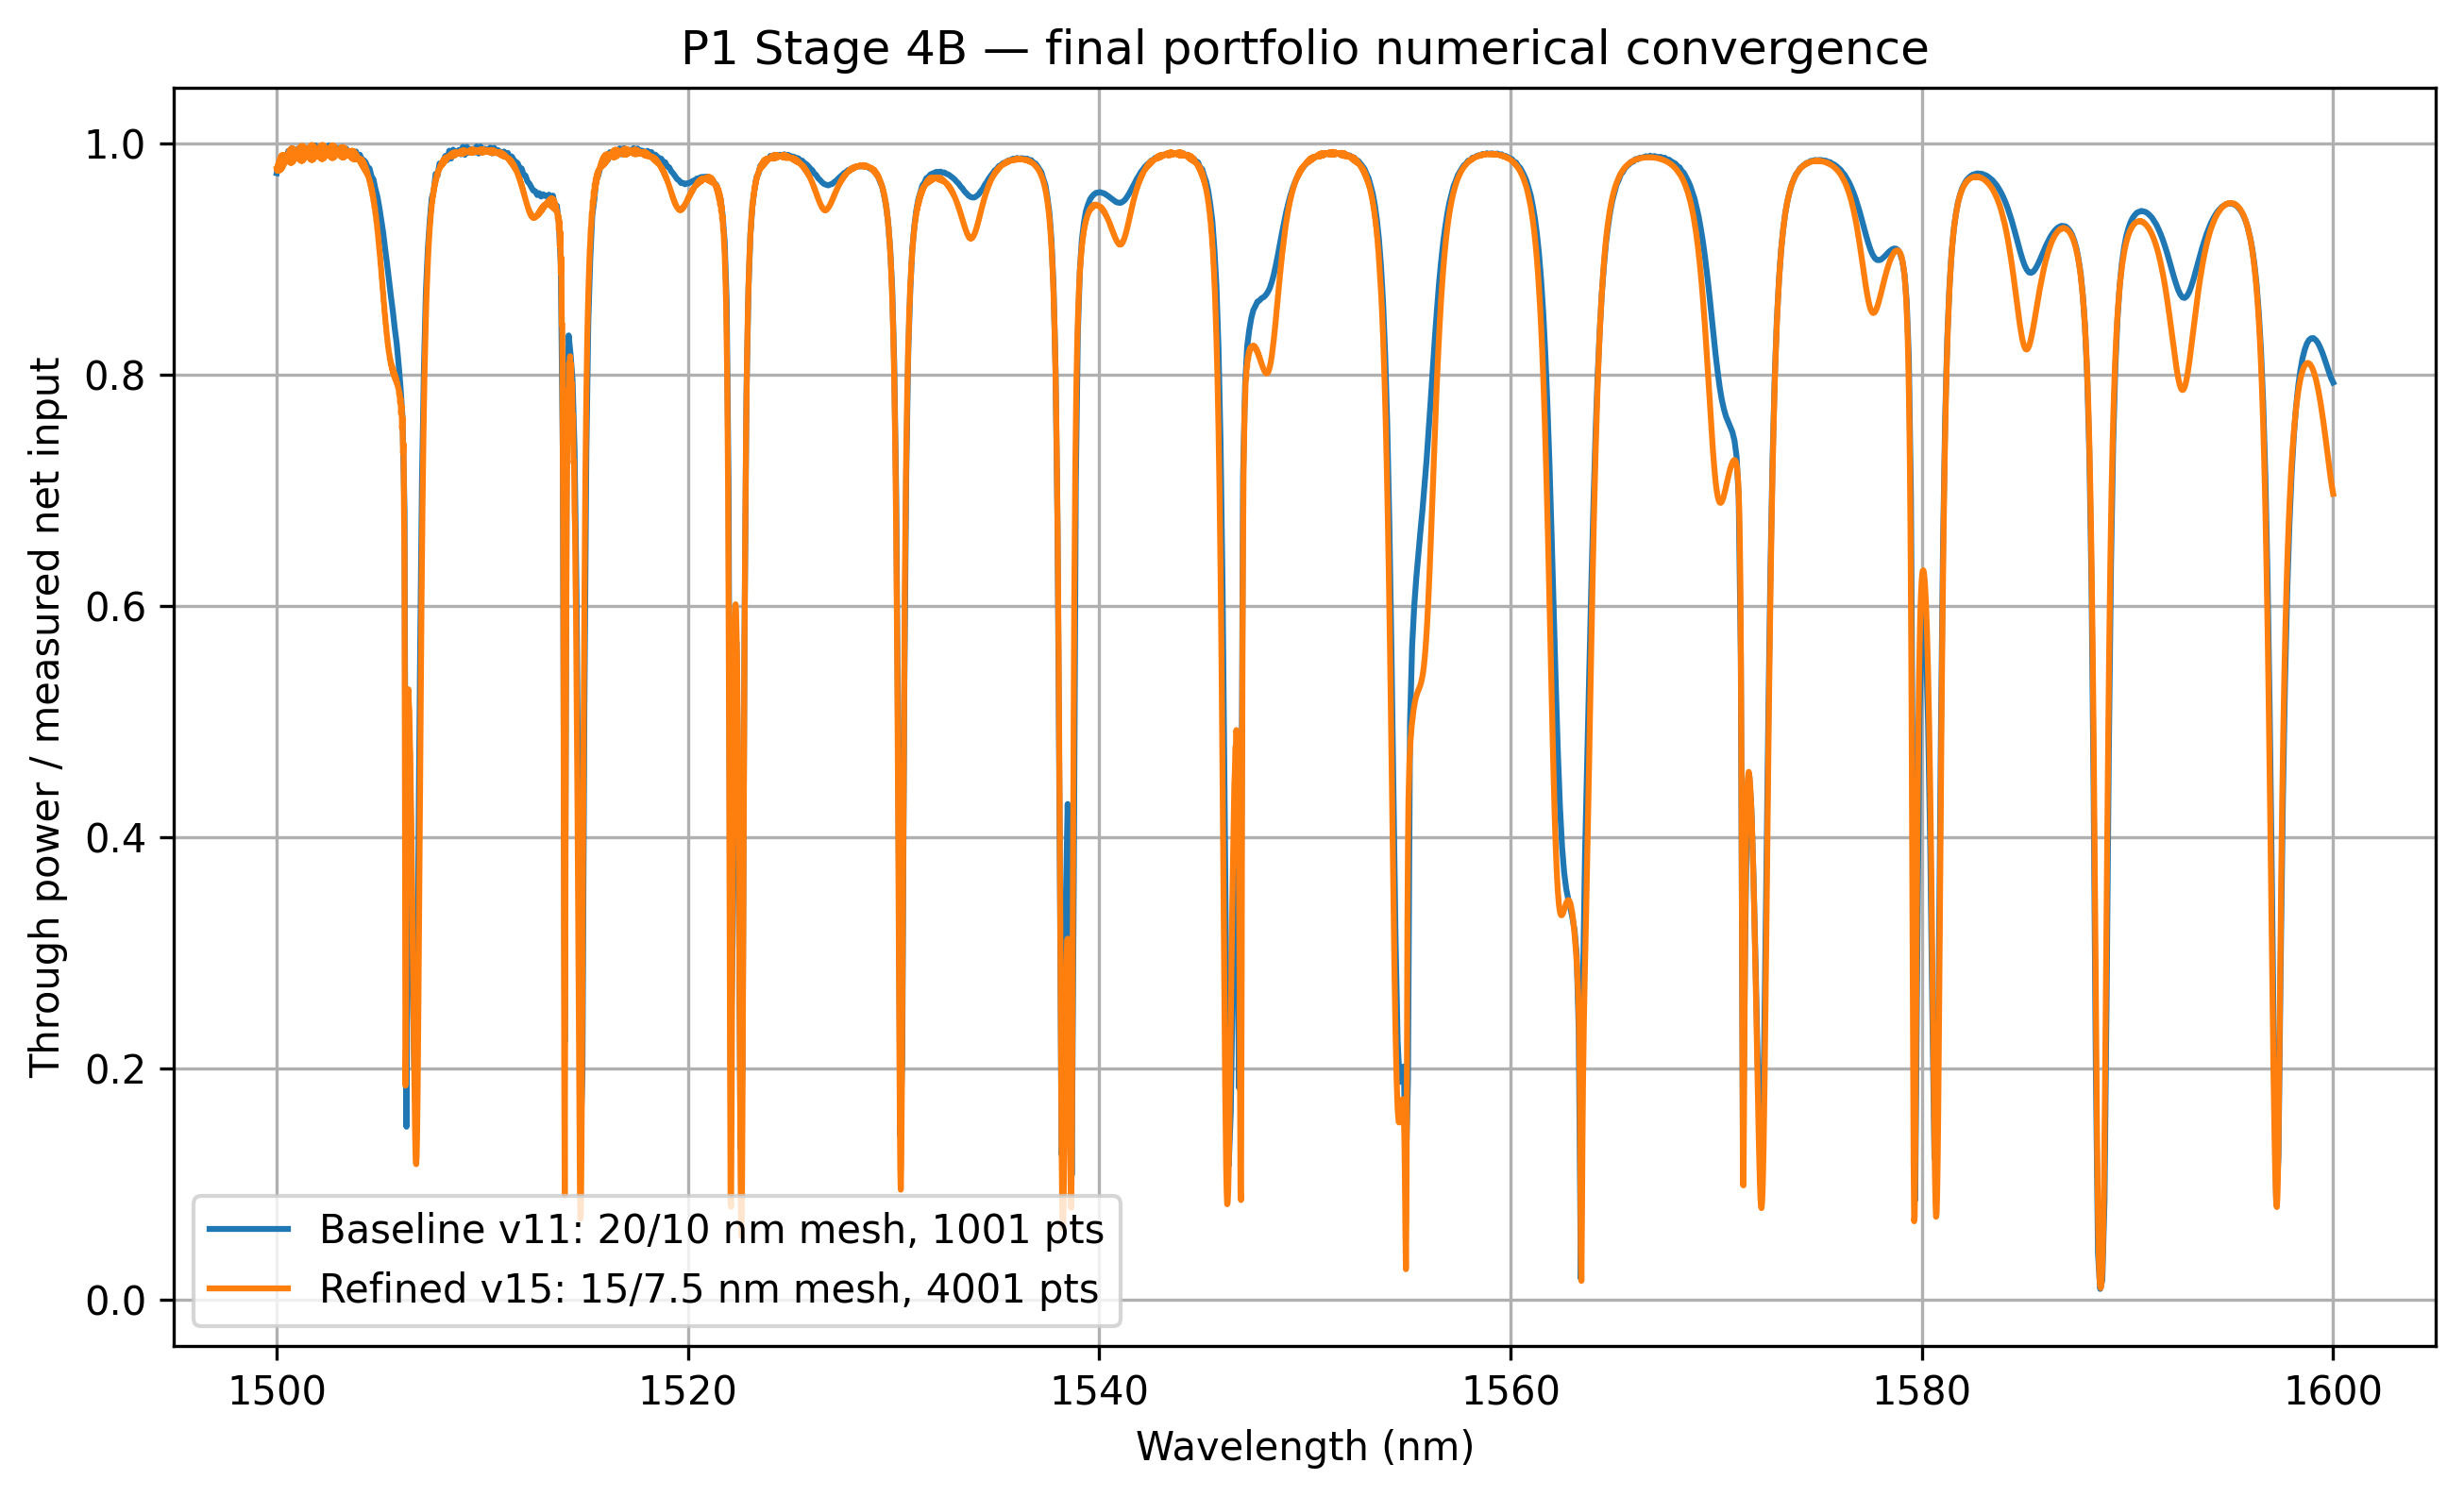
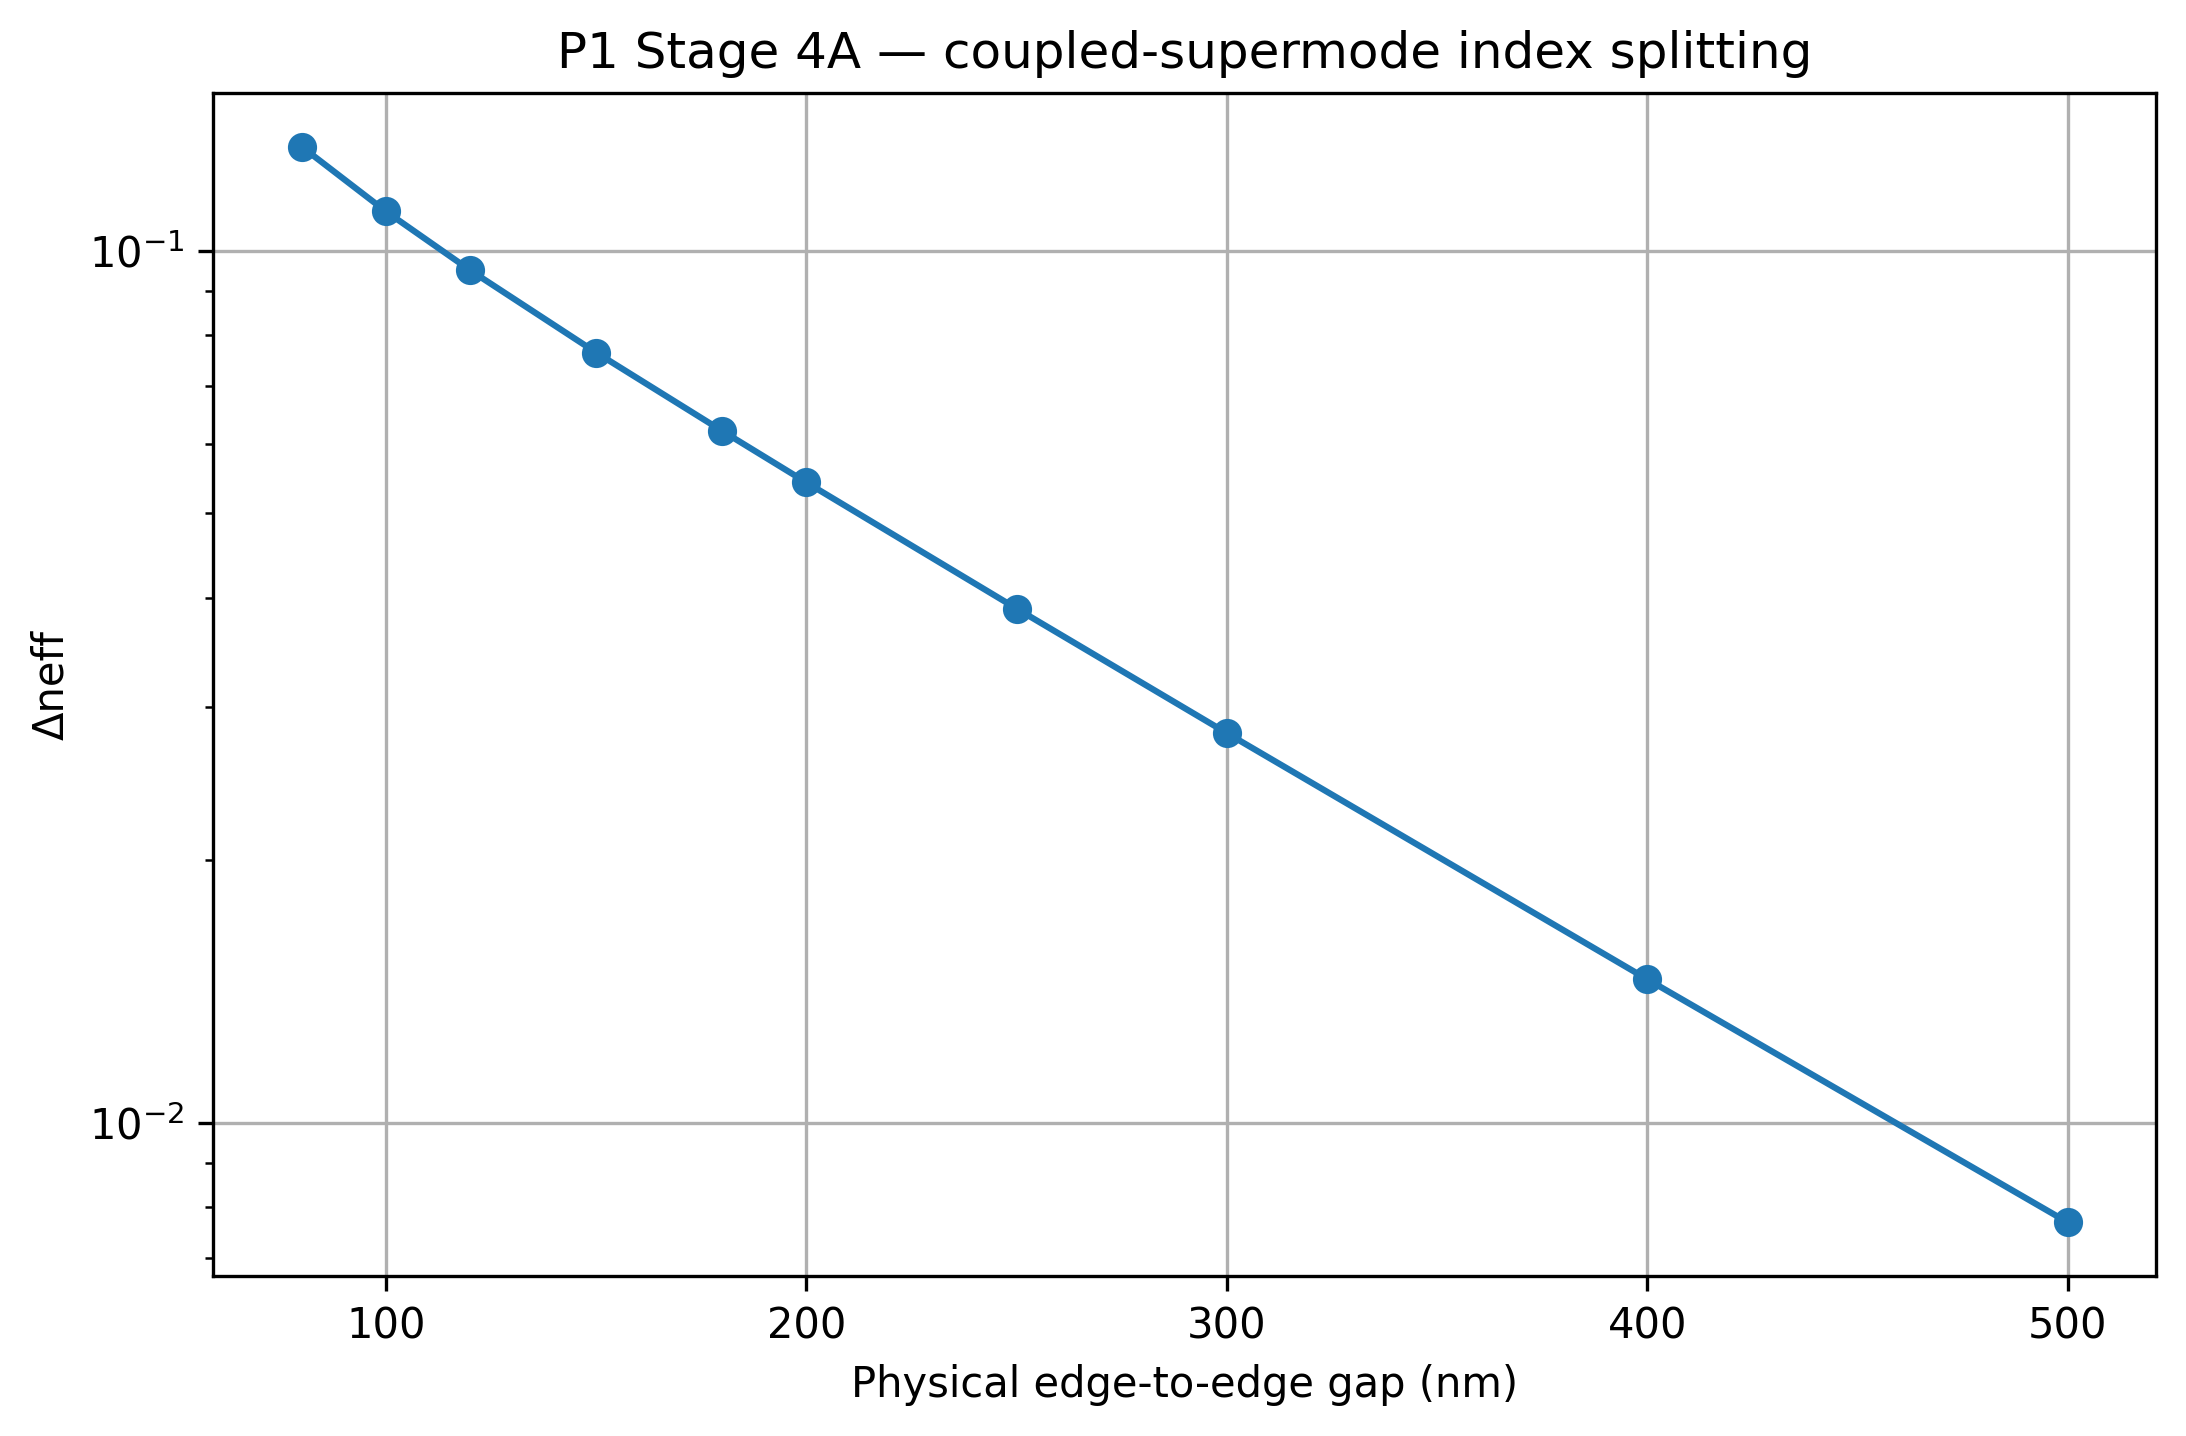
These are project-generated result figures from the public reproducibility repository, not decorative reconstructions.
Methodology
Simulation workflow
01
SOI strip-waveguide baseline
Establish the waveguide geometry and characterize the fundamental quasi-TE guided mode.
02
Domain and mesh convergence
Check numerical stability before using the waveguide model for subsequent analysis.
03
Dispersion and group index
Evaluate effective index, wavelength dependence, and group index across the operating spectral range.
04
Bend-radius characterization
Track the guided mode through bent-waveguide models and assess the selected ring-radius region.
05
Coupling-gap pre-screen
Use even- and odd-supermode splitting in a straight two-waveguide system to characterize coupling versus physical separation.
06
Full add-drop microring
Build and simulate the complete curved-ring model with MODE varFDTD at the selected design point.
07
Time-decay and net-flux checks
Verify solver termination behavior and inspect net-flux-normalized spectral response.
08
Mesh and spectral refinement
Repeat the final model under refinement checks to quantify changes in resonance and derived metrics.
09
Resonance extraction
Extract resonance wavelengths, free spectral range, loaded Q, and extinction ratio from the final spectrum.
Numerical Validation
Explicit convergence evidence
The repository records explicit project-specific acceptance criteria rather than treating a single unconverged spectrum as the final result.
| Check | Result | Project criterion | Status |
|---|---|---|---|
| Solver termination | Auto-shutoff | Must reach auto-shutoff | Pass |
| Maximum net-flux balance | 1.00015 | ≤ 1.01 | Pass |
| FSR relative change | 0.643% | ≤ 1% | Pass |
| Median resonance shift | 0.0259 nm | ≤ 0.15 nm | Pass |
| Same-grid median-Q change | 8.78% | ≤ 20% | Pass |
These thresholds are project-specific portfolio convergence criteria and are not presented as universal Ansys accuracy standards.
Intermediate Physics Checks
Supporting numerical evidence
Dispersion and group index
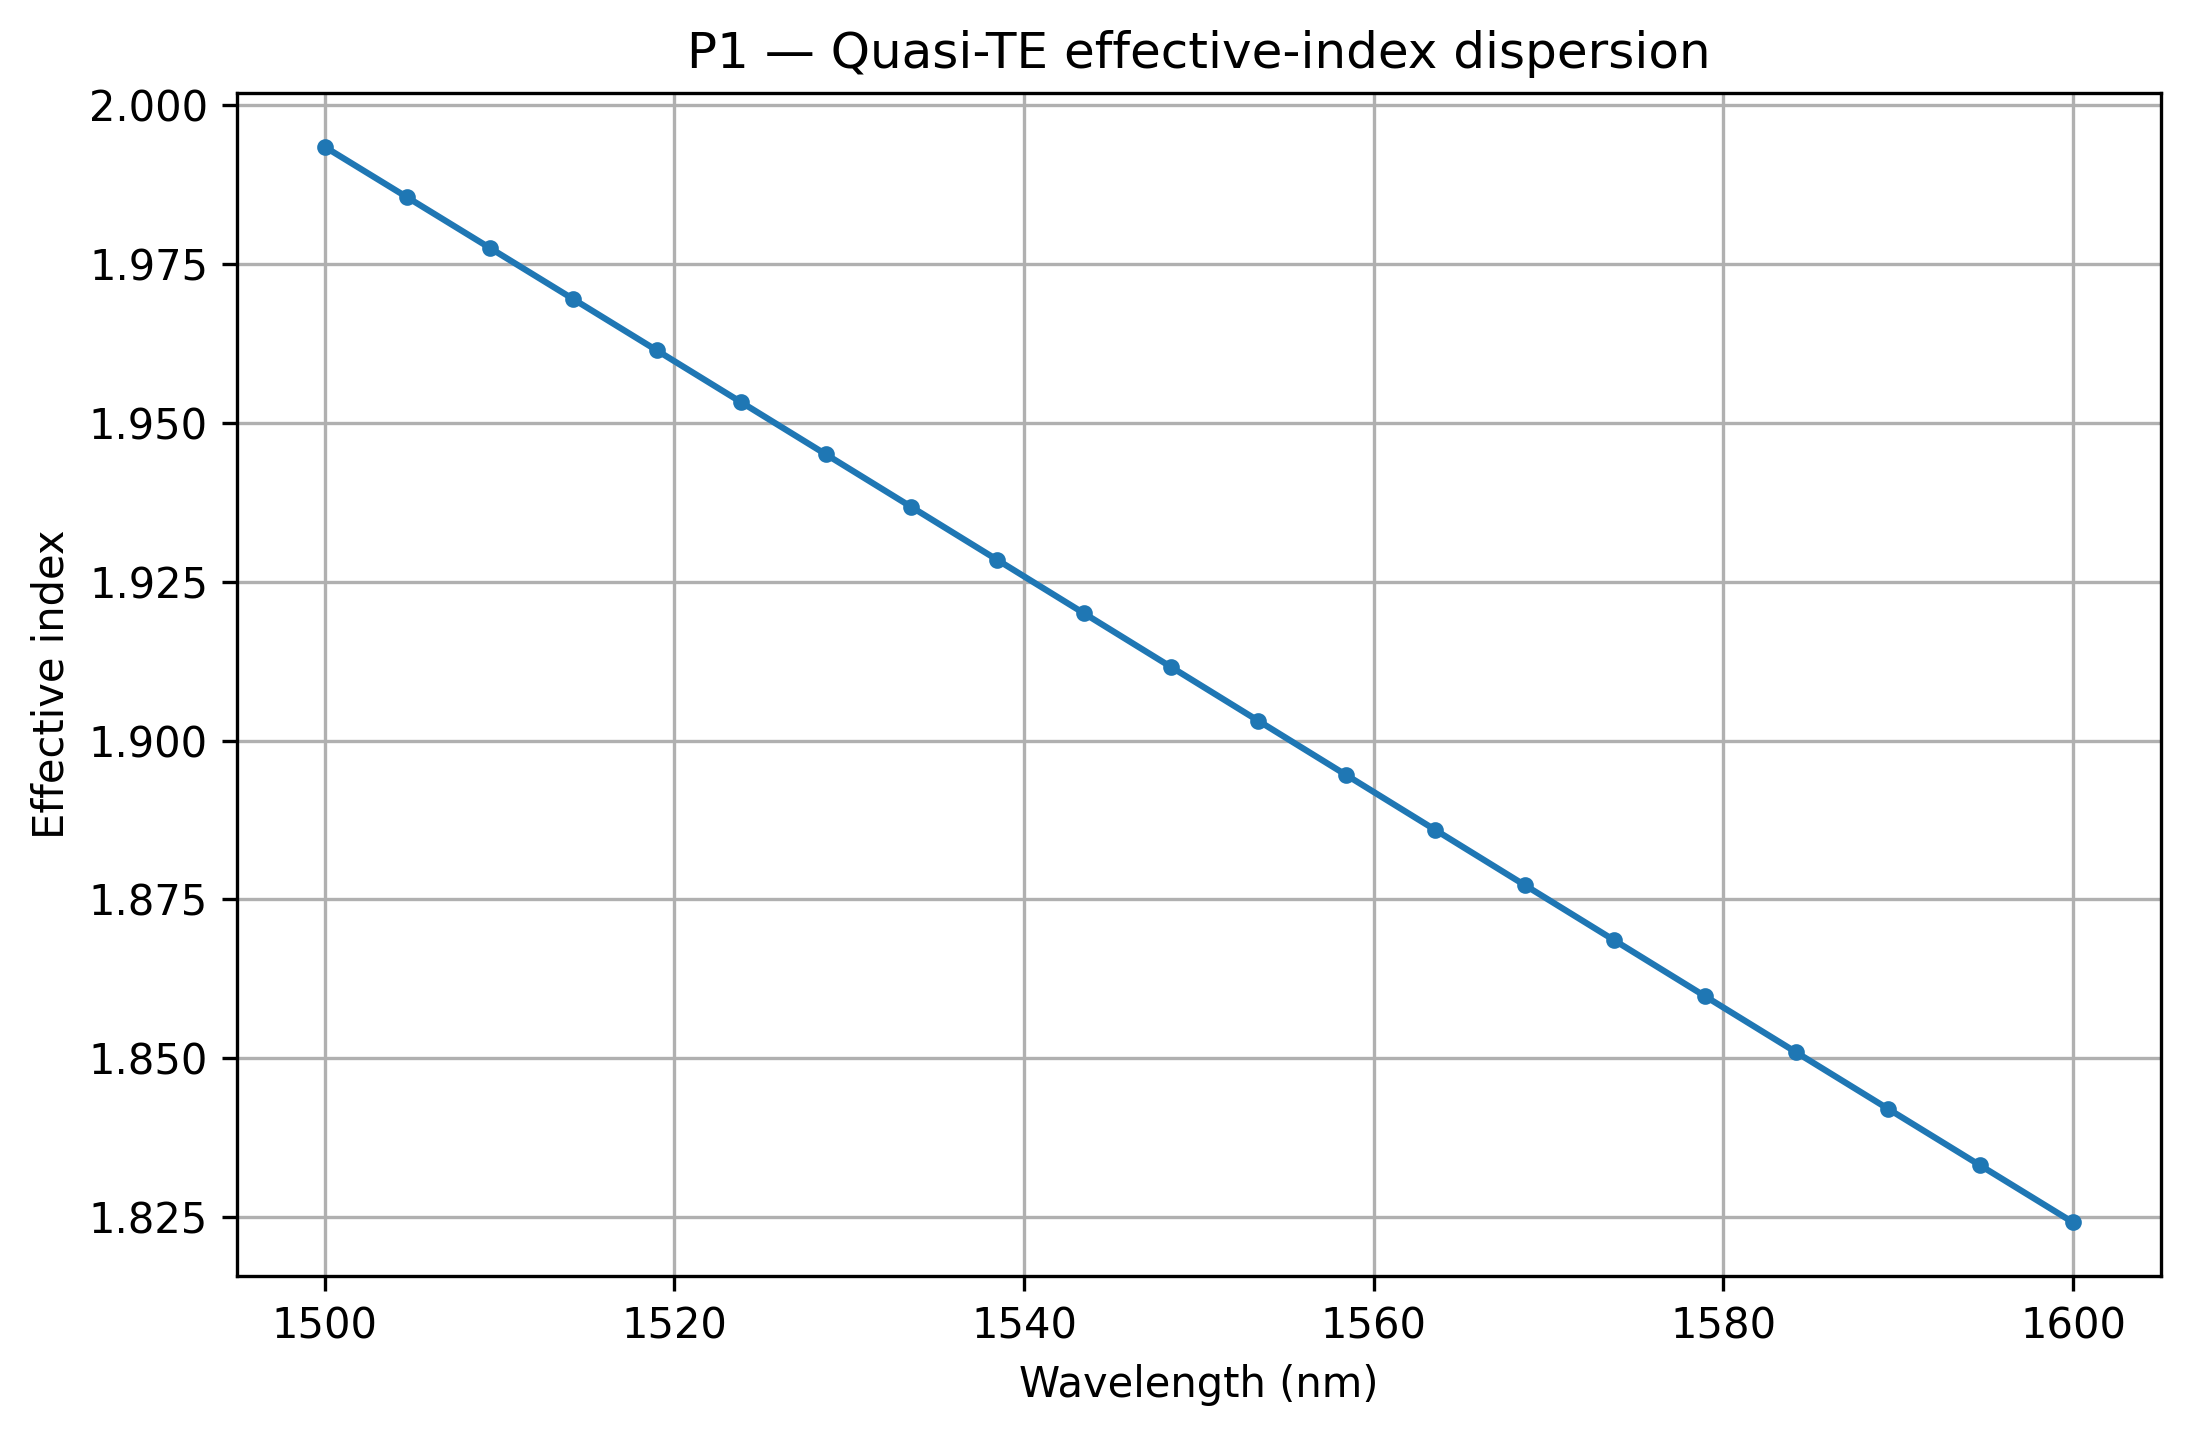
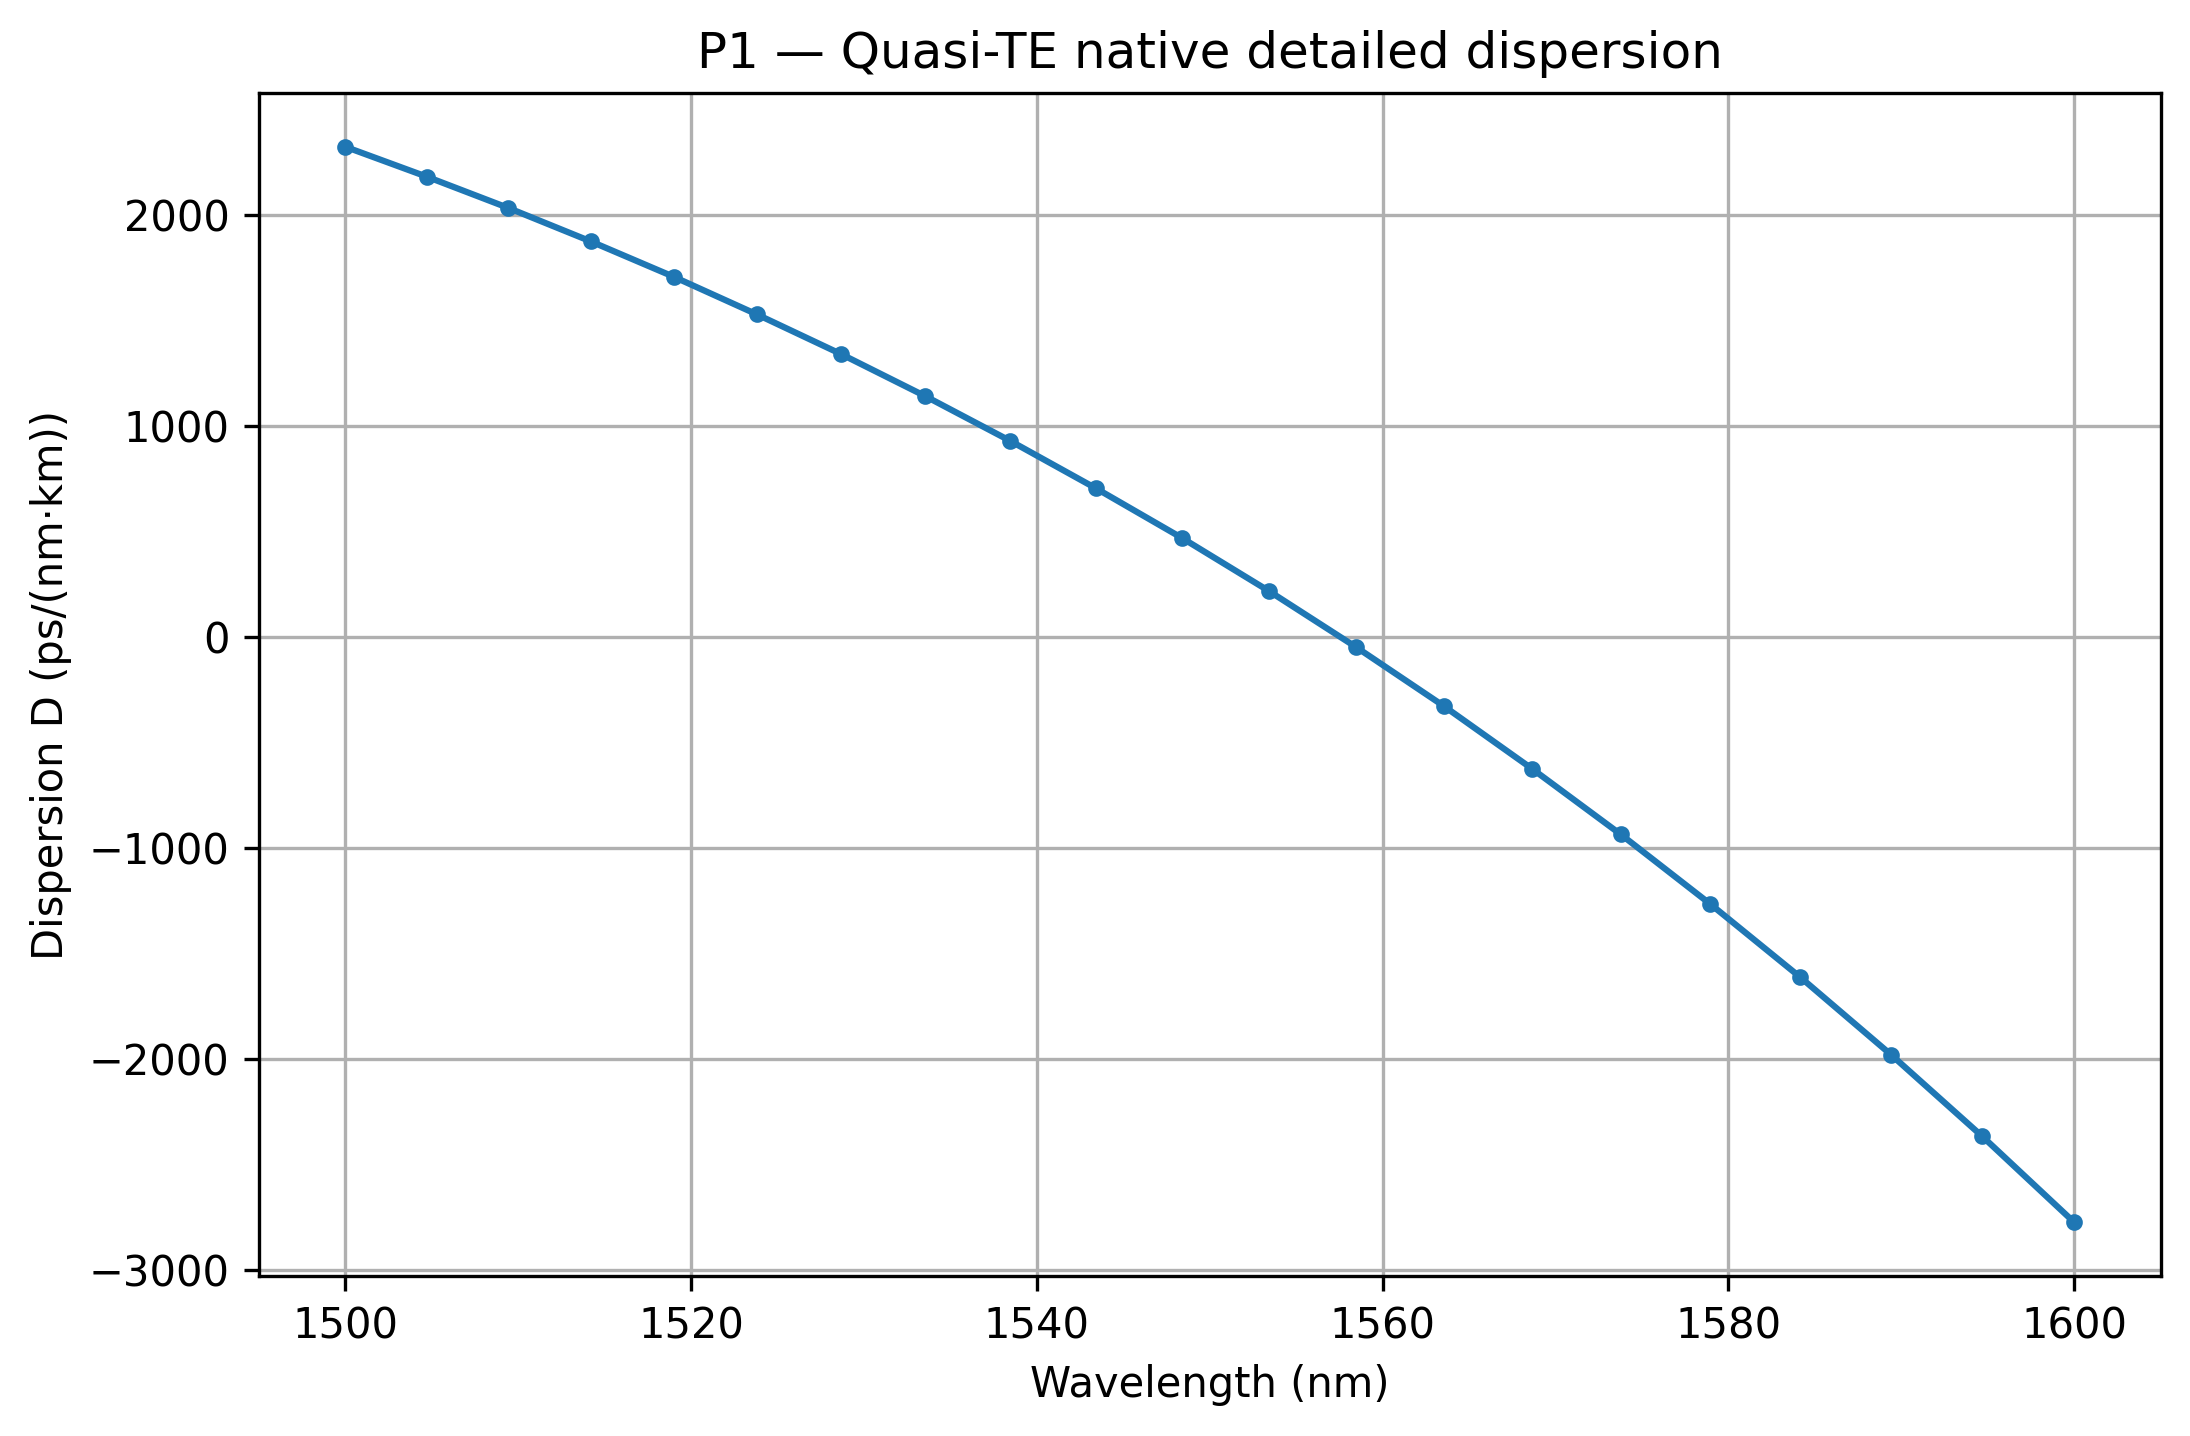
At 1550 nm, the modeled effective index is 1.908883743 and the native group index is 4.538092401. A separately derived group-index value agrees with the native value to a relative difference of approximately 1.37 × 10⁻⁵.
Bend-radius characterization
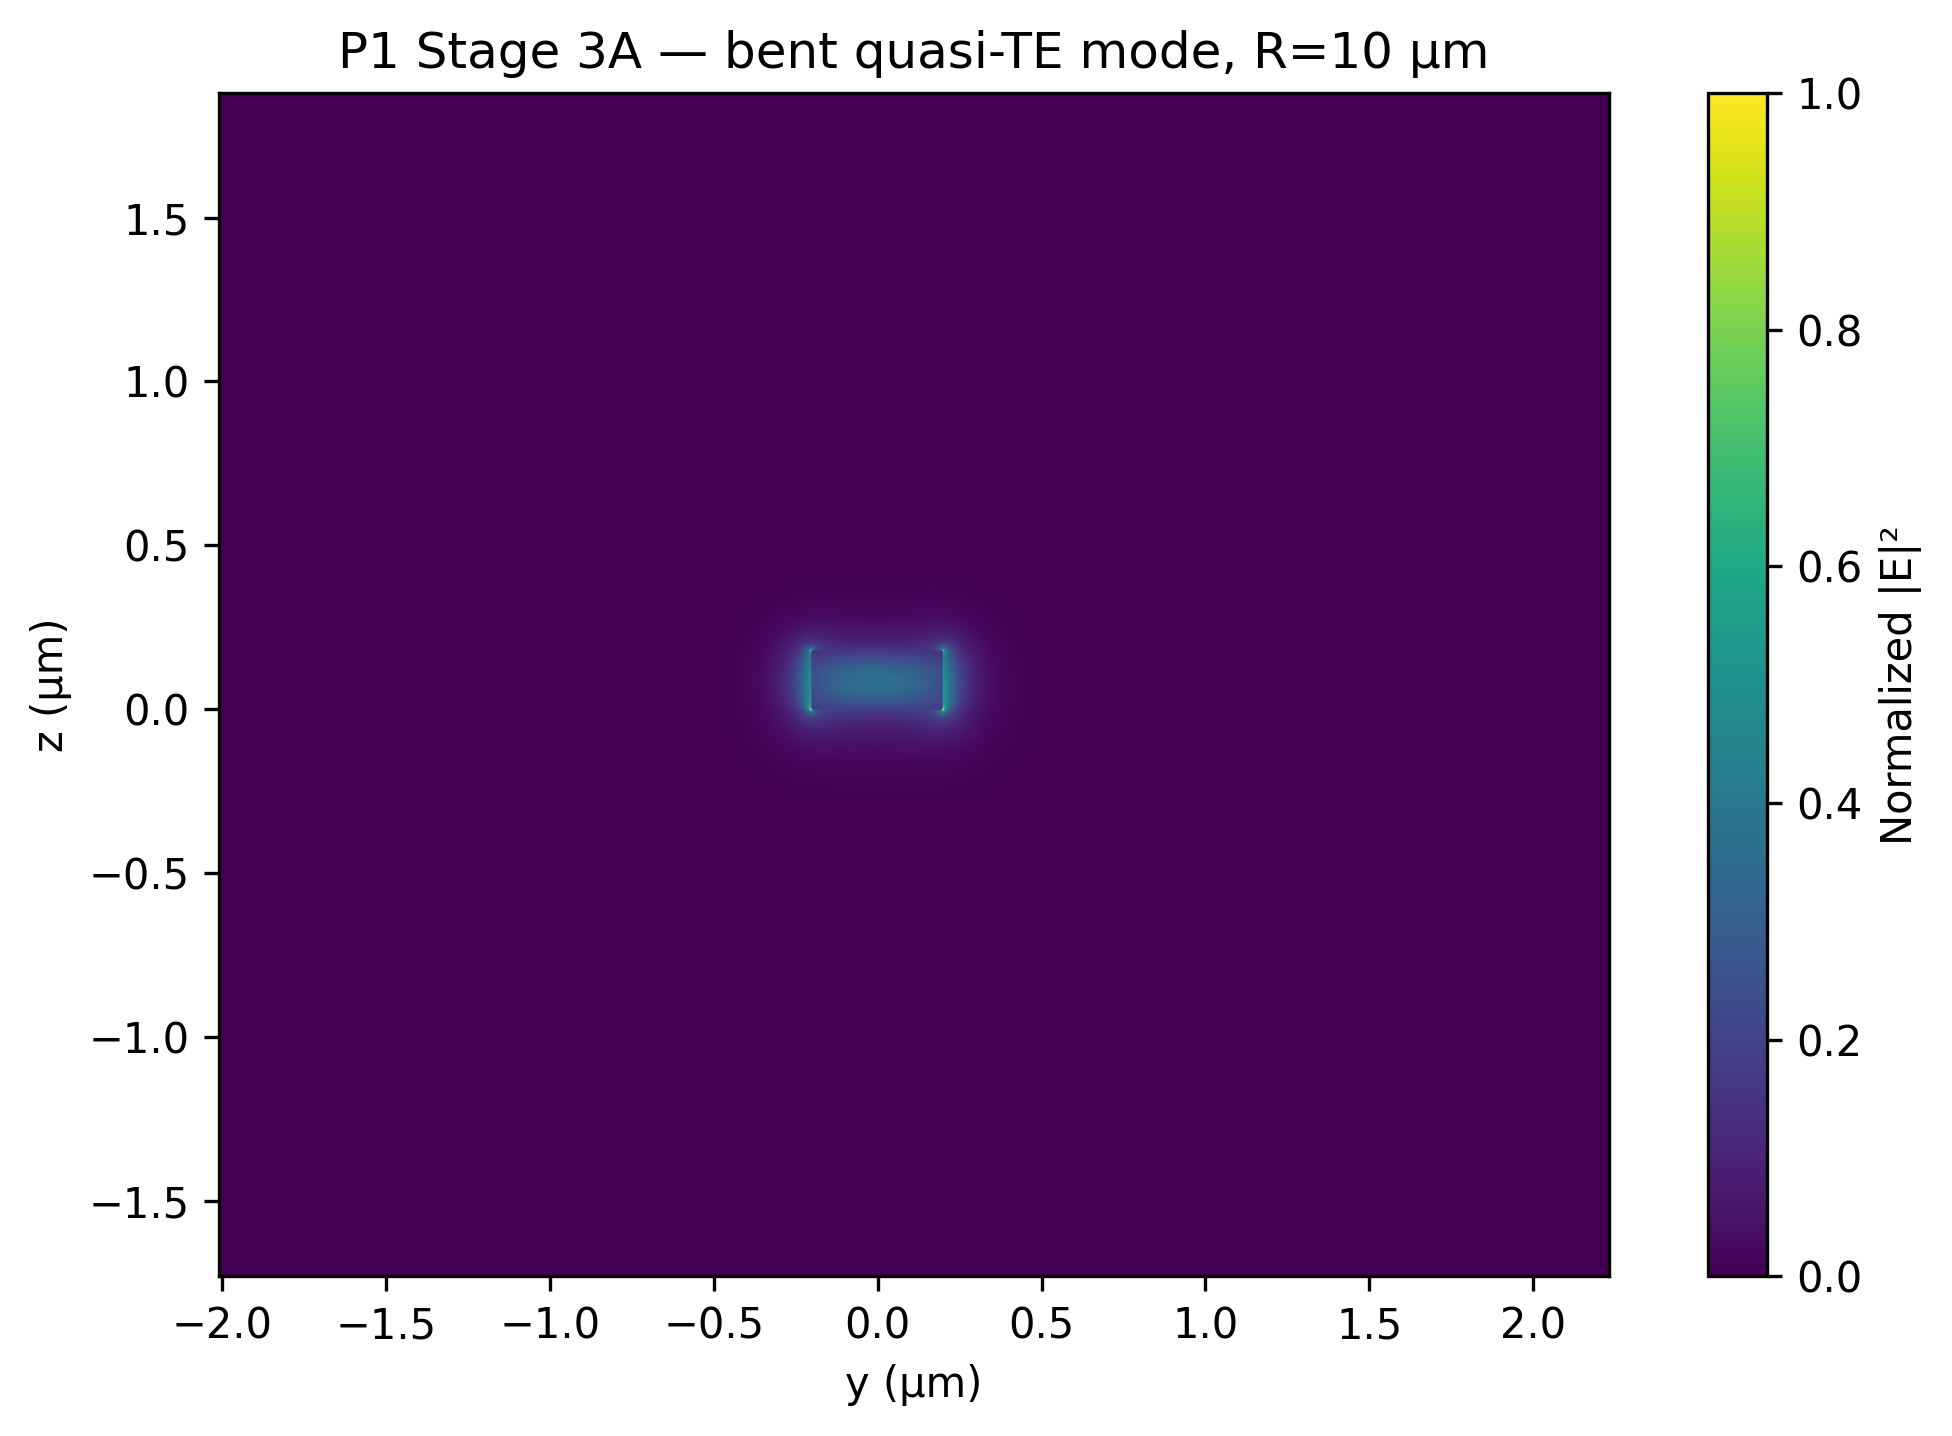
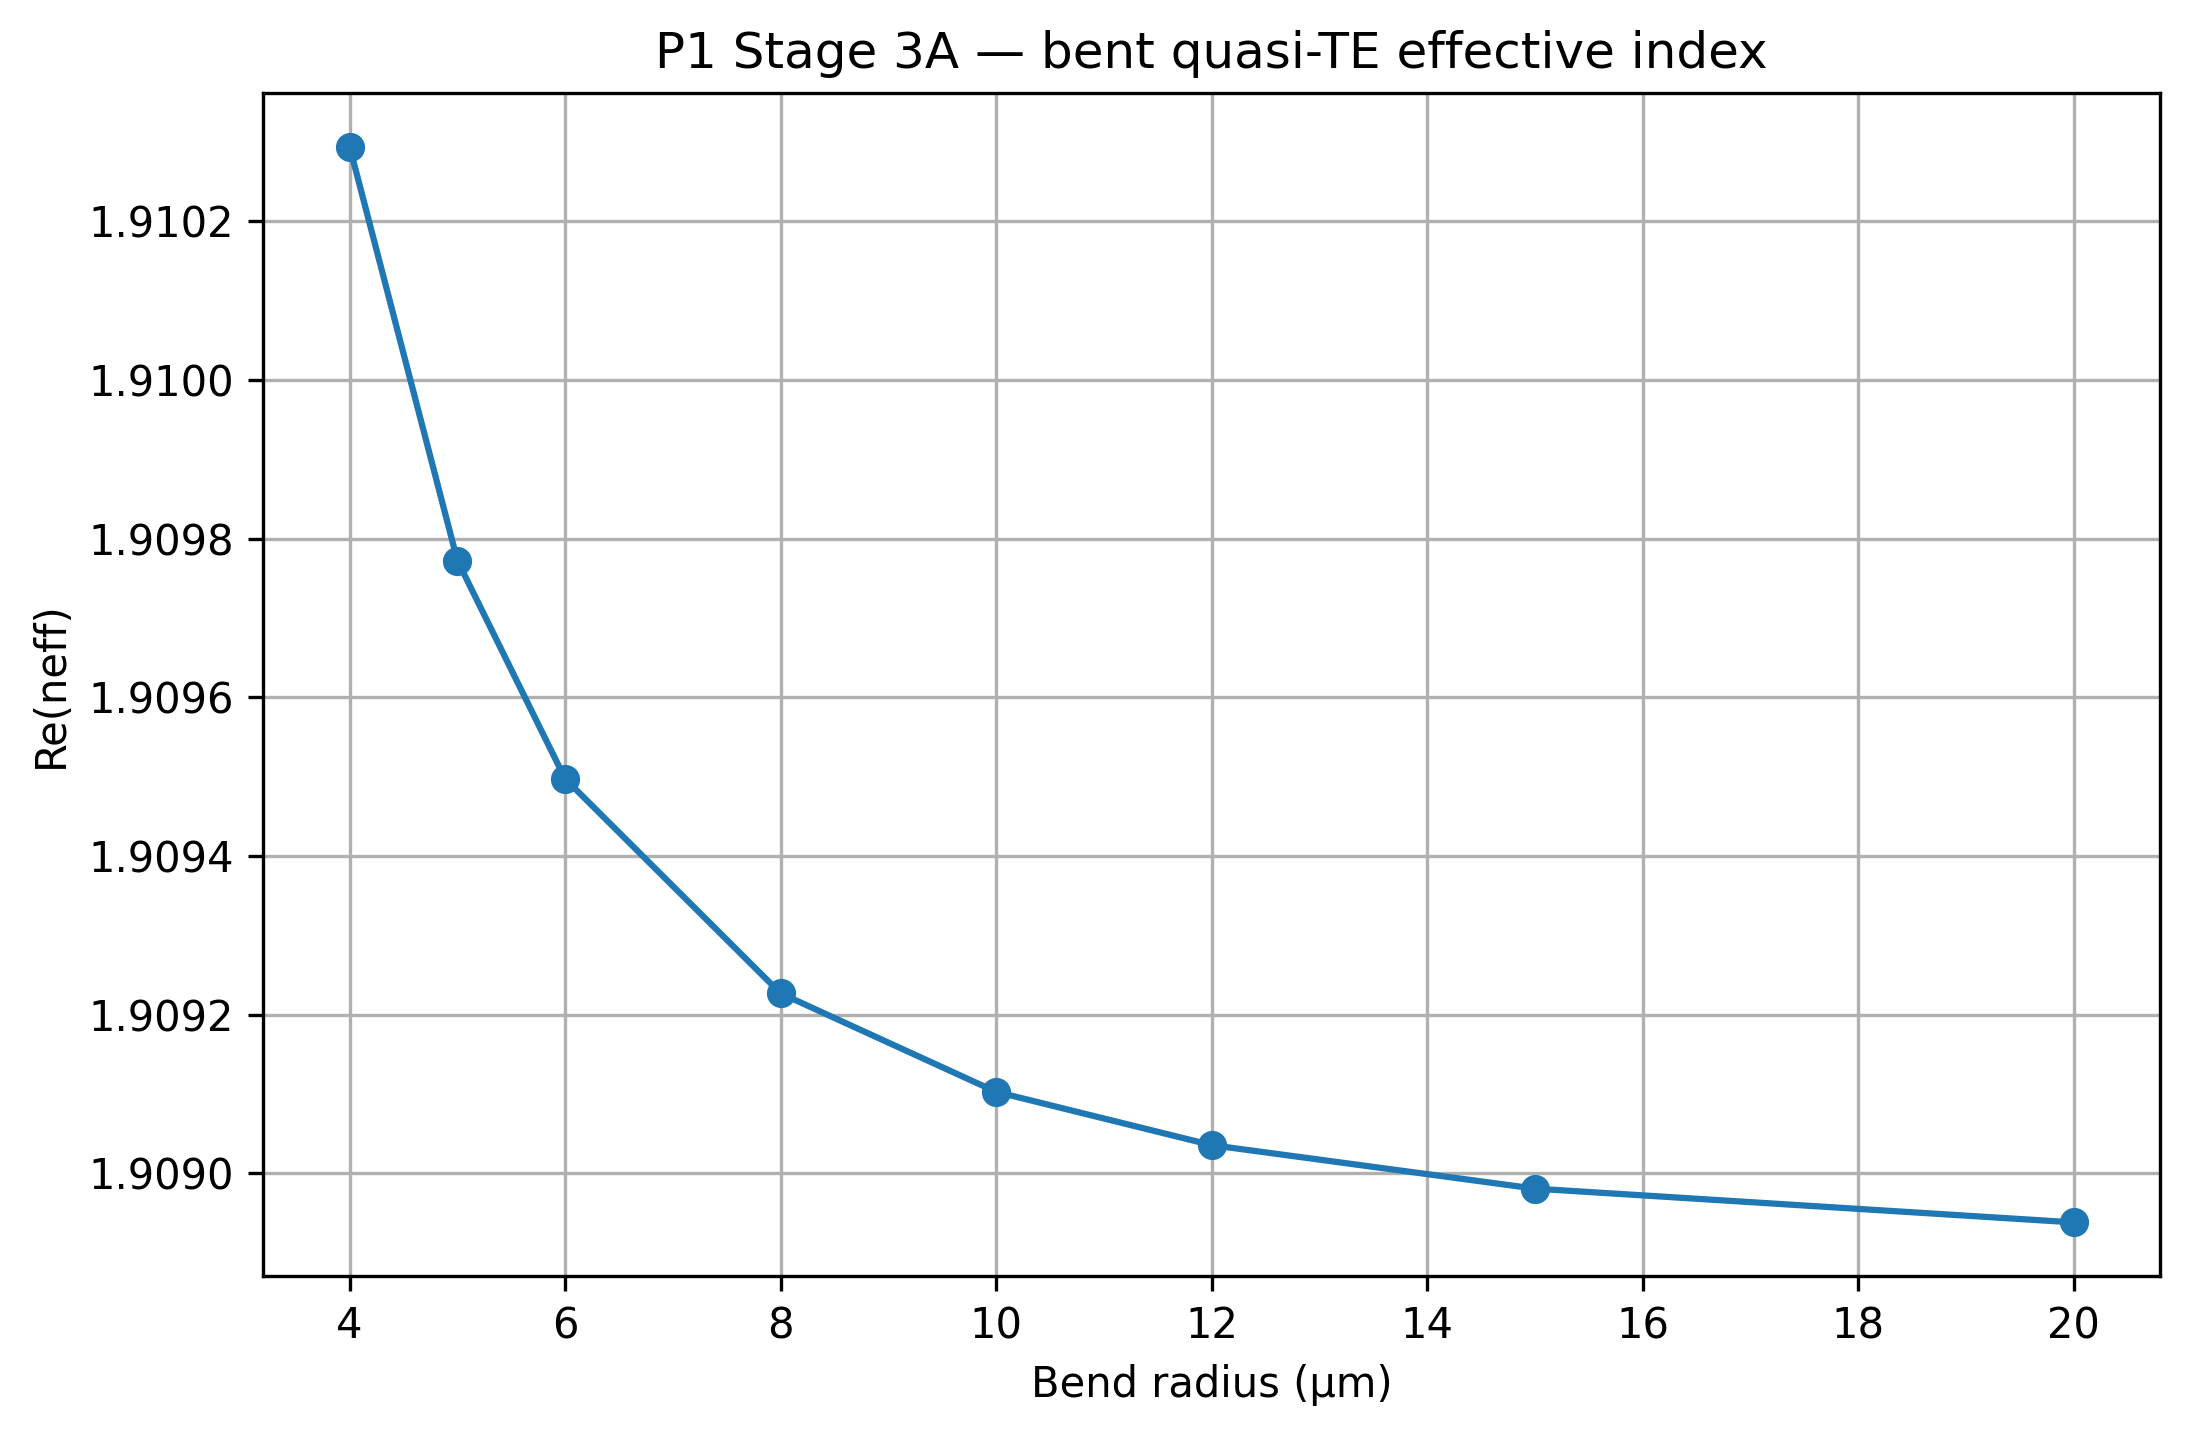
The selected 10 µm radius retained strong modal overlap with the straight-waveguide reference and passed the exterior-field decay screen used in the project.
Coupling-gap pre-screen
Even/odd supermode splitting decreased monotonically as physical separation increased. The straight-coupler sweep was used only as a pre-screen; the 200 nm design point was subsequently evaluated in the complete curved-ring model.
Reproducibility
Public data and reproducible scripts
The public repository separates final numerical datasets, curated intermediate results, plotting utilities, model reproduction scripts, and methodology notes.
Lightweight plots can be regenerated with Python without Ansys Lumerical. Reproducing the final electromagnetic model requires Ansys Lumerical MODE and its Python API.
Explore repository files- data/final/ Final spectrum, resonances, and summary data
- data/intermediate/ Curated dispersion, bend, and coupling datasets
- figures/ Portfolio and result figures
- scripts/ Reproduction and plotting scripts
- docs/ Methodology and reproducibility notes
Scientific Scope
Limitations and interpretation
The final electromagnetic validation in this release uses MODE varFDTD rather than full 3D FDTD. The reported loaded-Q values should therefore be interpreted as varFDTD estimates for the stated model and convergence settings.
The project is computational. Fabrication and experimental validation are outside the scope of the current release.
The 200 nm coupling gap is a validated design point within the reported computational workflow; it is not presented as a global optimum over all possible ring and coupler geometries.